Pore-scale Fluid Flow Simulation and Particle Tracing
My primary focus in this example is to present numerical simulation of a pore-scale flow, which is here represented by single-phase flow in porous structures characterized by complex pore-volume configurations in three dimensions, which is generated from a from a real CT image. Pore-scale flow has a wide applications ranging from groundwater movement to oil reservoir management.
Problem Definition
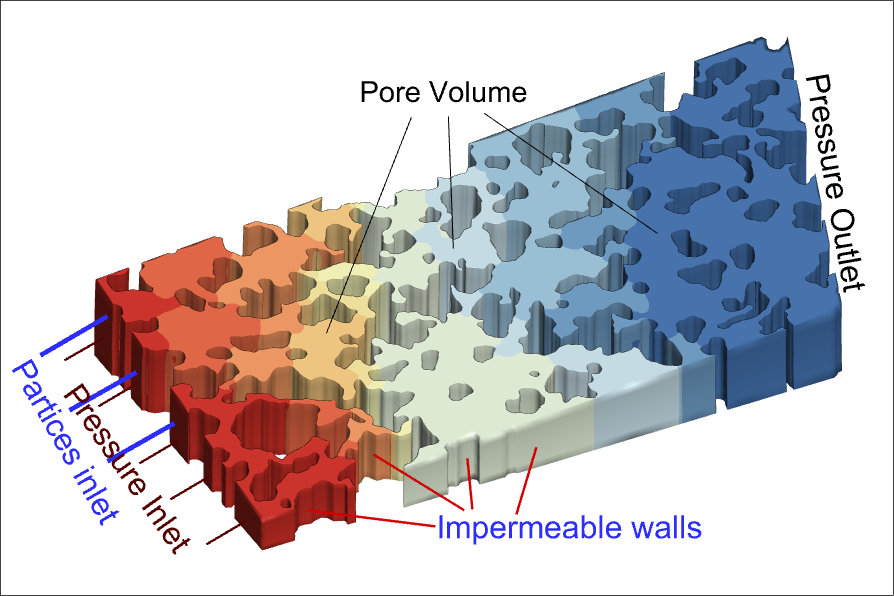
As shown in the figure below, fluid is injected through the left wall of the medium, while the existing fluid is extracted from the right wall. To enhance the realism of the model, particles are released from three specific boundaries along the left wall, as illustrated in the accompanying figure. While symmetry boundary conditions are applied on the top and bottom walls of the medium, The remaining walls of the medium are assumed to be impermeable and no-slip conditions are applied. This setup allows for a basic understanding of how flow dynamics interact with intricate pore structures.
The computational domain along with boundary condition imposed on the left and right walls of the medium
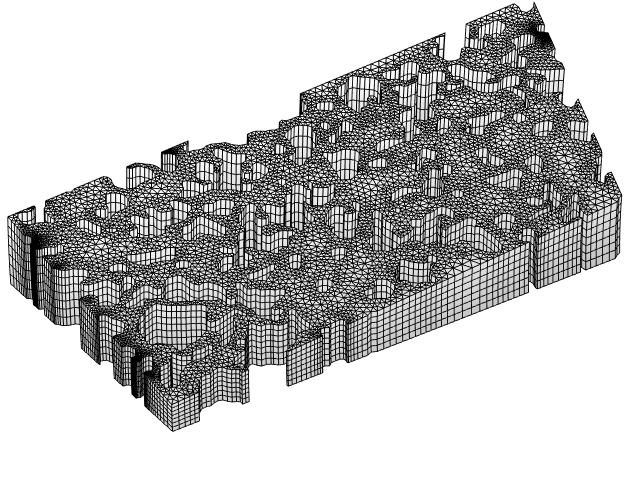
A typical computational grid consisting of triangular prisms
Assumptions, initial and boundary conditions
Incompressible Laminar Flow
Newtonian Fluid
Rigid Porous Medium
Continuous flow
Rigid Particle
Computational aspects
For the simulation, I employ the Finite Element Method (FEM) method, utilizing first-order elements for both pressure and velocity variables. The process begins with generating a two-dimensional geometry from a real CT image and constructing the three-dimensional model. Then, a computational grid on the top surface of the medium is generated by using triangular elements, which are then extended in the normal direction to create three-dimensional elements, as depicted in the figure above. Importantly, I ensure that the simulation results reflect mesh-independent outcomes, leading to reliable and accurate data.
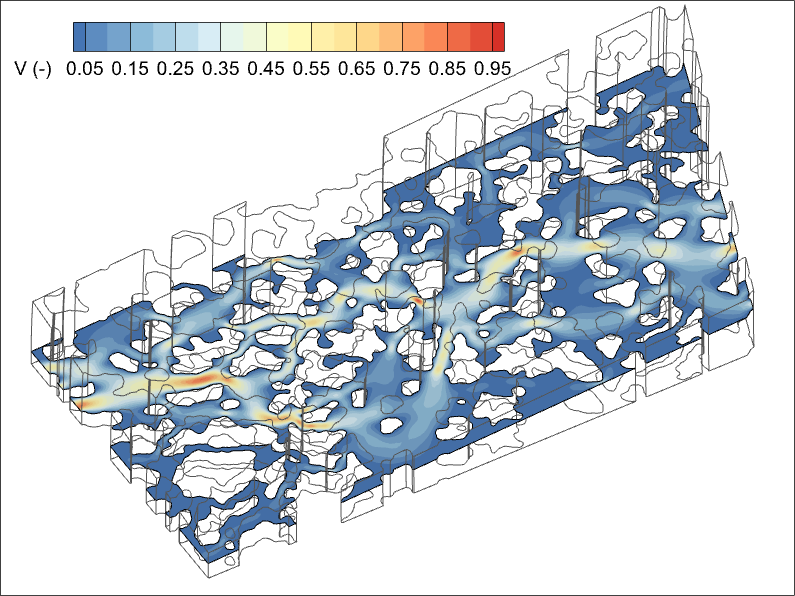
Numerical Results
The result of these simulations is visually represented through normalized velocity contour plots, accompanied by animations of particle trajectories. This visualization illustrates the complicated behavior of the fluid flow through the trajectories of particles within the porous medium.
Notes
Let’s work togetherto make innovations
For collaboration or inquiries, feel free to reach out! Contact me learn more about how my simulation skills can benefit your team and your project!